The Reports page breaks your call results down by agency, agent, team, publisher, state and queue for any date range, adds charts and an agent scorecard, and exports everything to CSV, Excel or PDF. At the bottom, the Custom Report Builder lets you group and filter the numbers your own way, save the report and have it emailed on a schedule.
Who can do this: supervisors and agency admins. Select Reports in the sidebar.
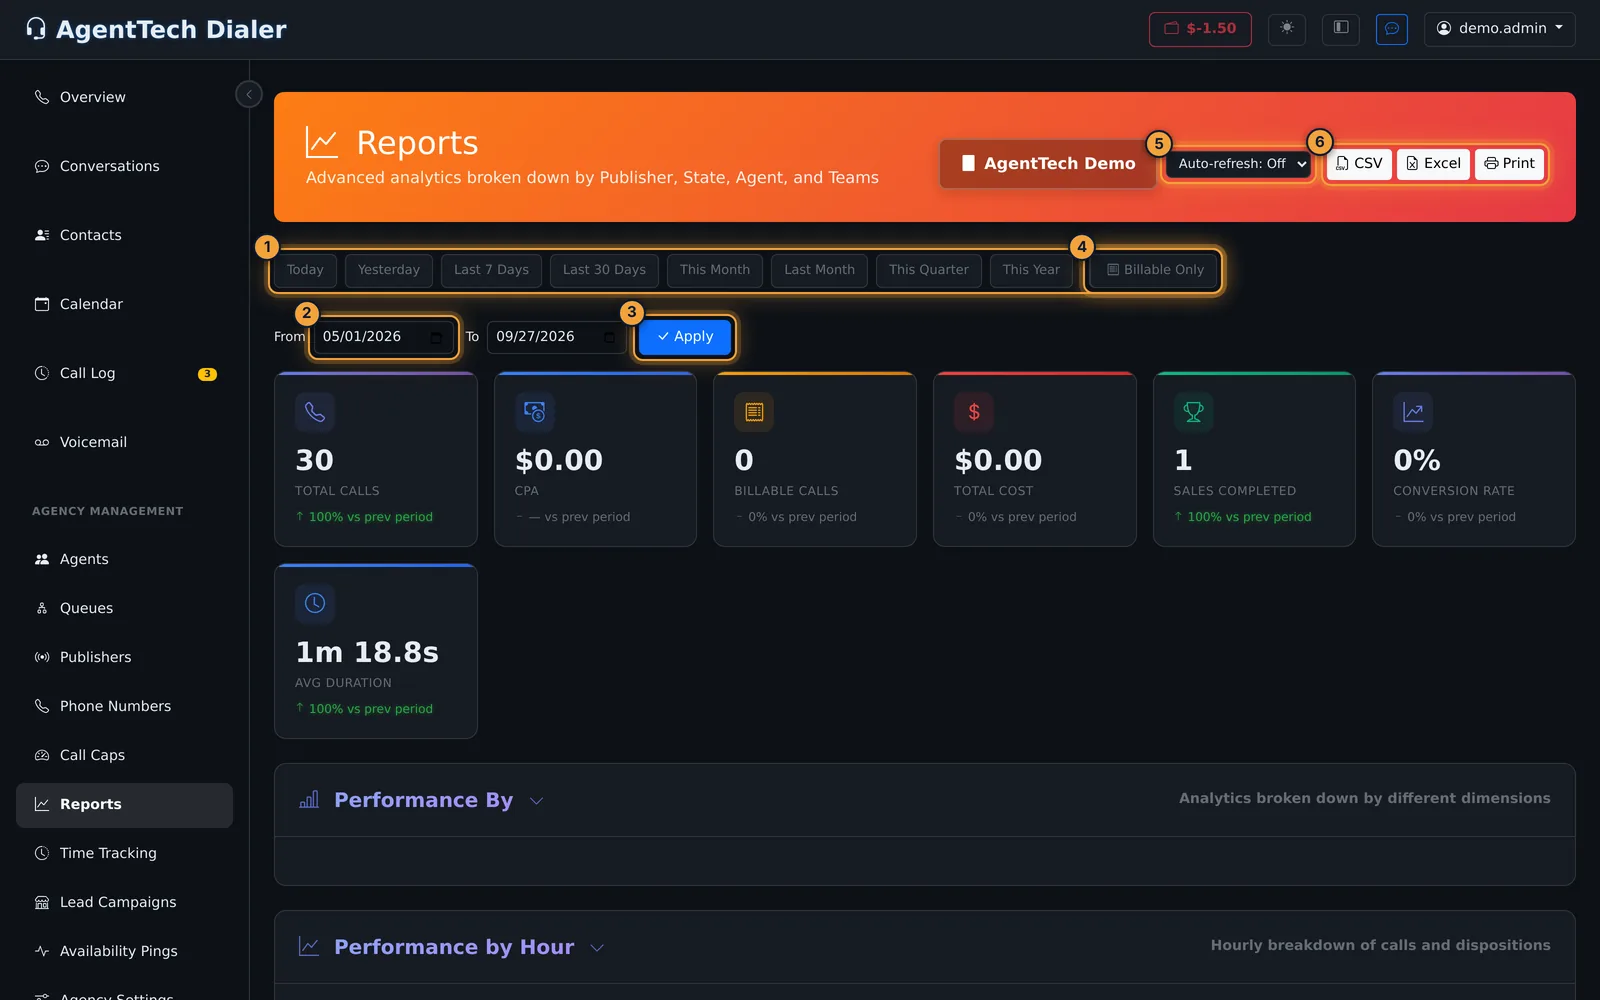
Choose the date range
- Select a preset: Today, Yesterday, Last 7 Days, Last 30 Days, This Month, Last Month, This Quarter or This Year.
- Or set From and To and select Apply.
- Select Billable Only to limit every card and table to billable calls. Select it again to include all calls.
The range is kept in the page address, so a bookmarked or shared link opens the same view. Auto-refresh reloads the numbers every 30 seconds, 1 minute or 5 minutes; your choice is remembered in this browser.
The seven KPI cards at the top, and every metric used on this page, are defined in KPIs & Leaderboard.
Read the sections
Each section below the cards opens and closes when you click its title, and the page remembers which ones you left open.
Performance By
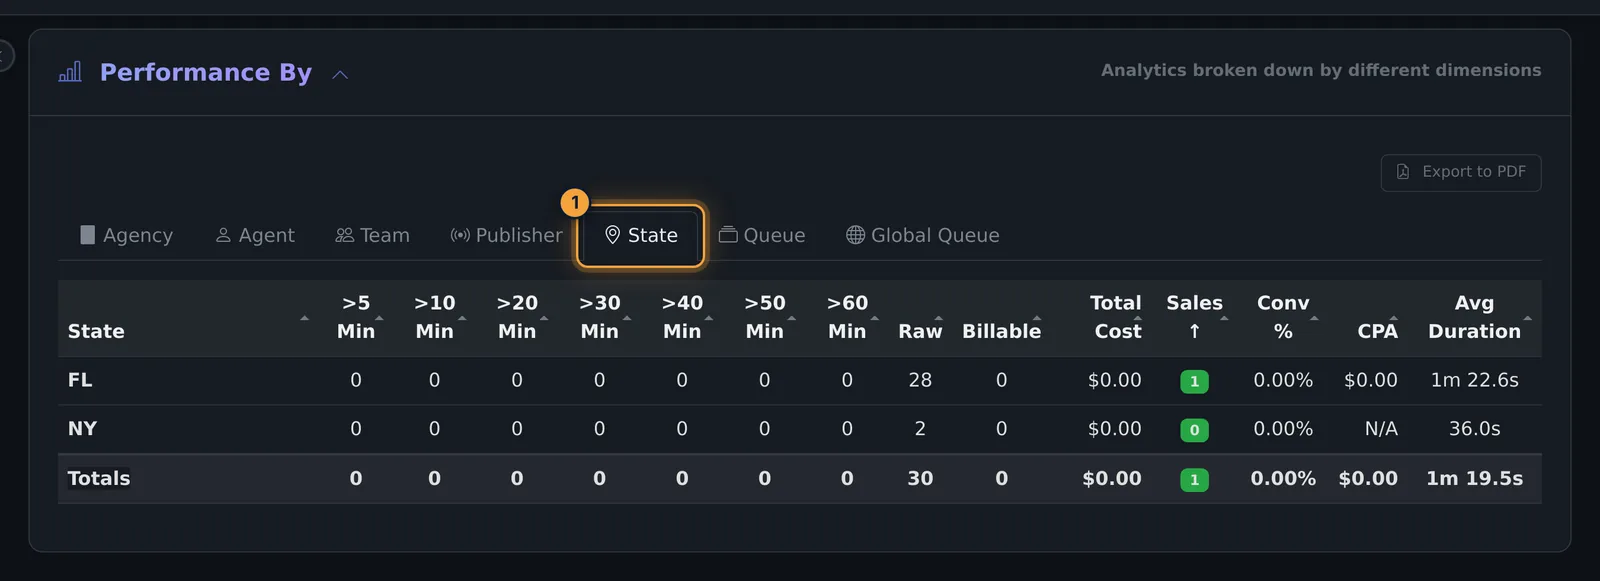
Tabs split the numbers by Agency, Agent, Team, Publisher, State, Queue and Global Queue. Click a column heading to sort, and select Export to PDF to download the open tab. Agent names open that agent's Agent Analytics page.
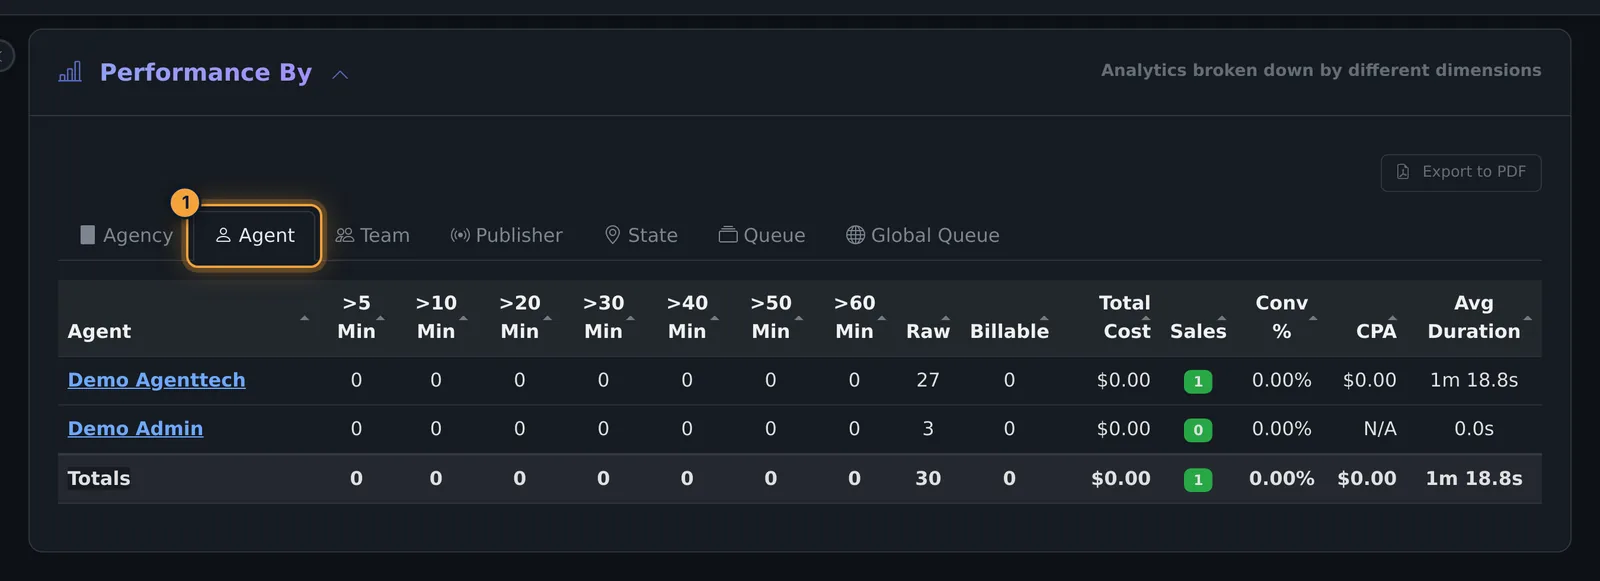
| Column | What it shows |
|---|---|
>5 Min to >60 Min | Calls longer than 5, 10, 20, 30, 40, 50 and 60 minutes. |
| Raw | All calls. |
| Billable, Total Cost, Sales, Conv %, CPA, Avg Duration | See KPIs & Leaderboard for each definition. |
The Totals row adds up each column; its Avg Duration is weighted by each row's calls.
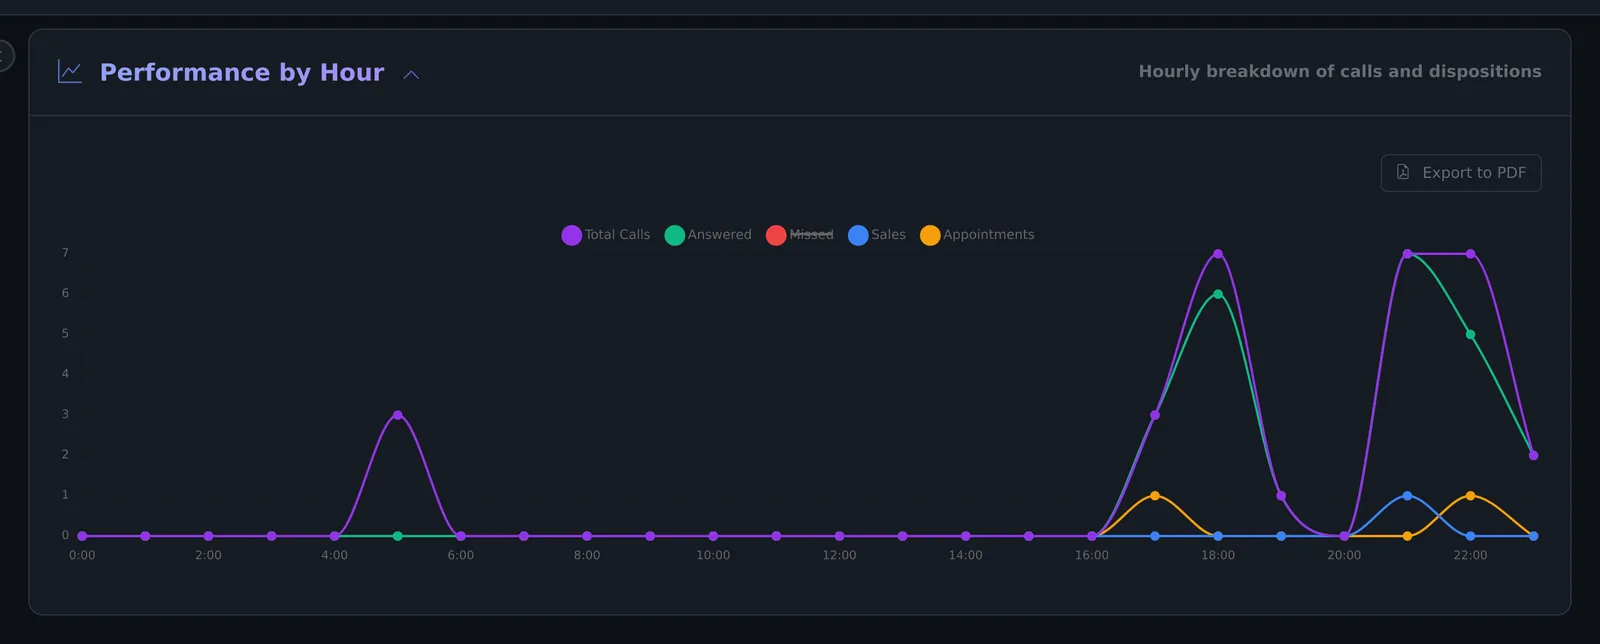
Performance by Hour
A line chart of Total Calls, Answered, Missed, Sales and Appointments for each hour of the day. Click a legend item to hide or show that line. Export to PDF saves the chart.
Agent Scorecard & Leaderboard
The Leaderboard tab shows the top ten agents by composite score; Detailed Scores ranks every agent and breaks the score down. How the score is calculated is in KPIs & Leaderboard.
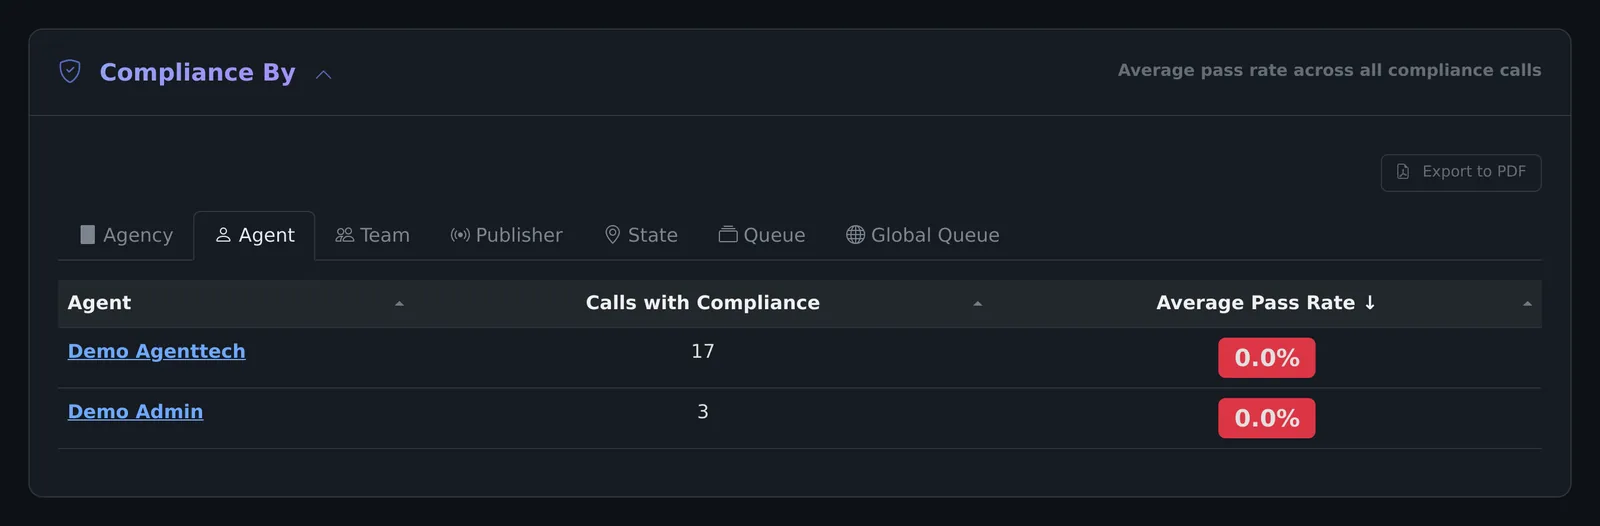
Compliance By
The average compliance pass rate and the number of calls checked for compliance, split by the same seven tabs as Performance By. Pass rates of 80% and up show green, 60-79% amber and below 60% red.
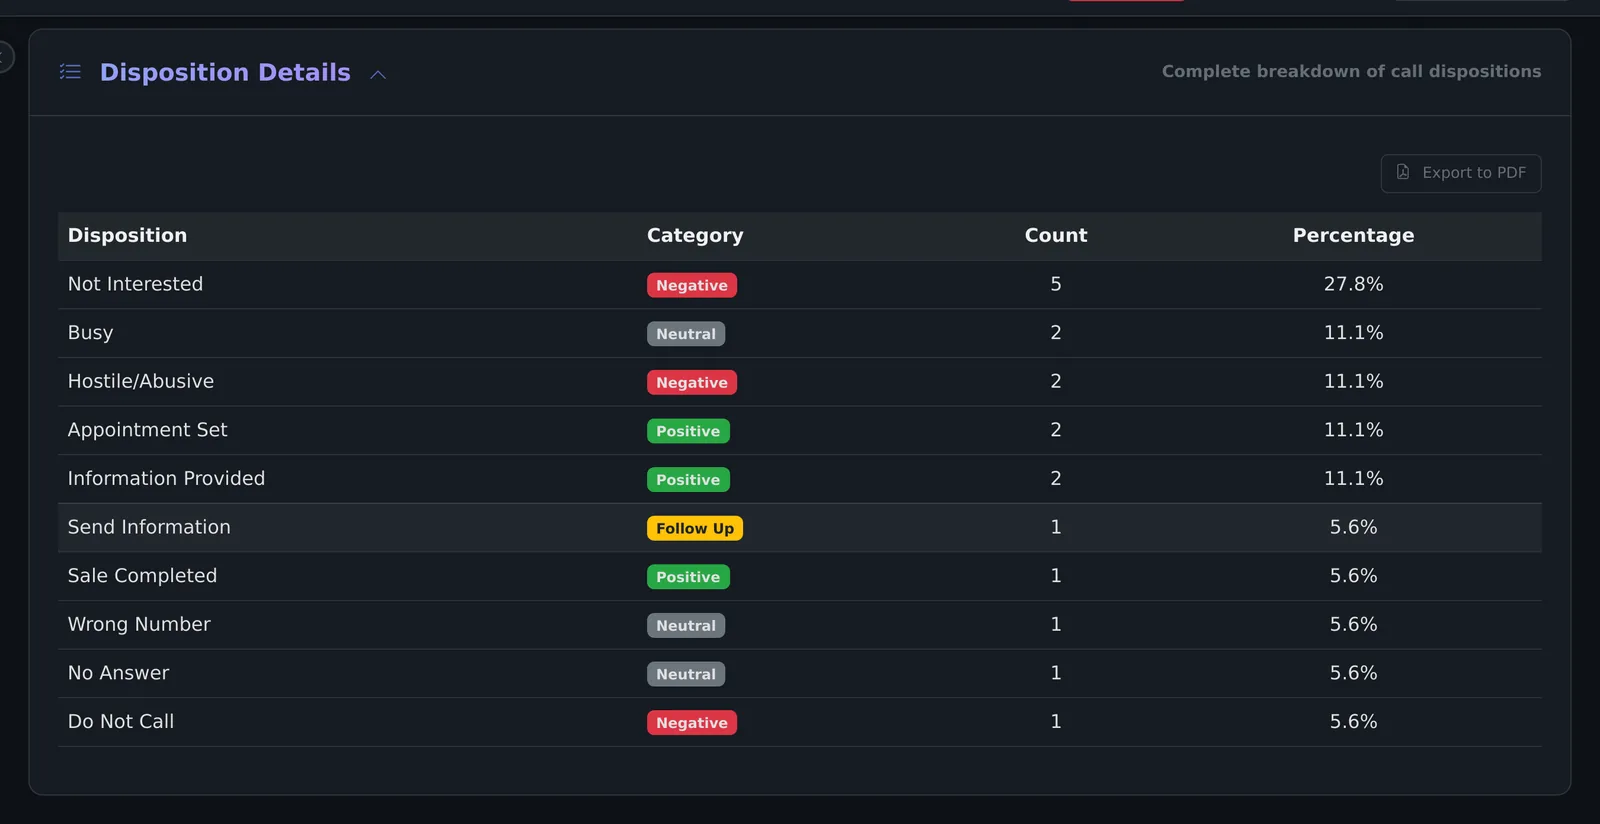
Disposition Details
Every disposition used in the range with its category (Positive, Negative, Follow Up or Neutral), how many calls got it and its share of all dispositioned calls.
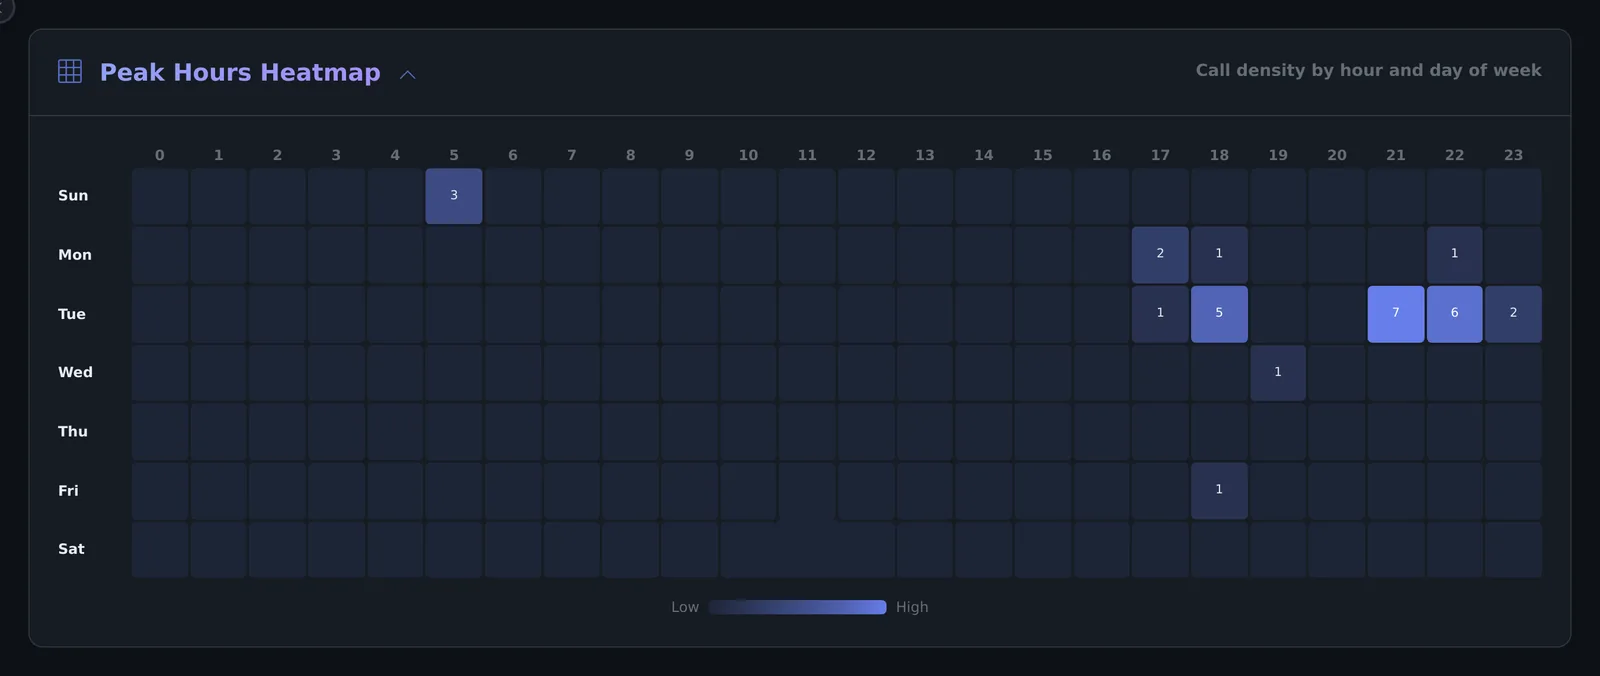
Peak Hours Heatmap
Calls by hour of day (0-23) and day of week. Darker to brighter cells mean more calls; each cell shows its count.
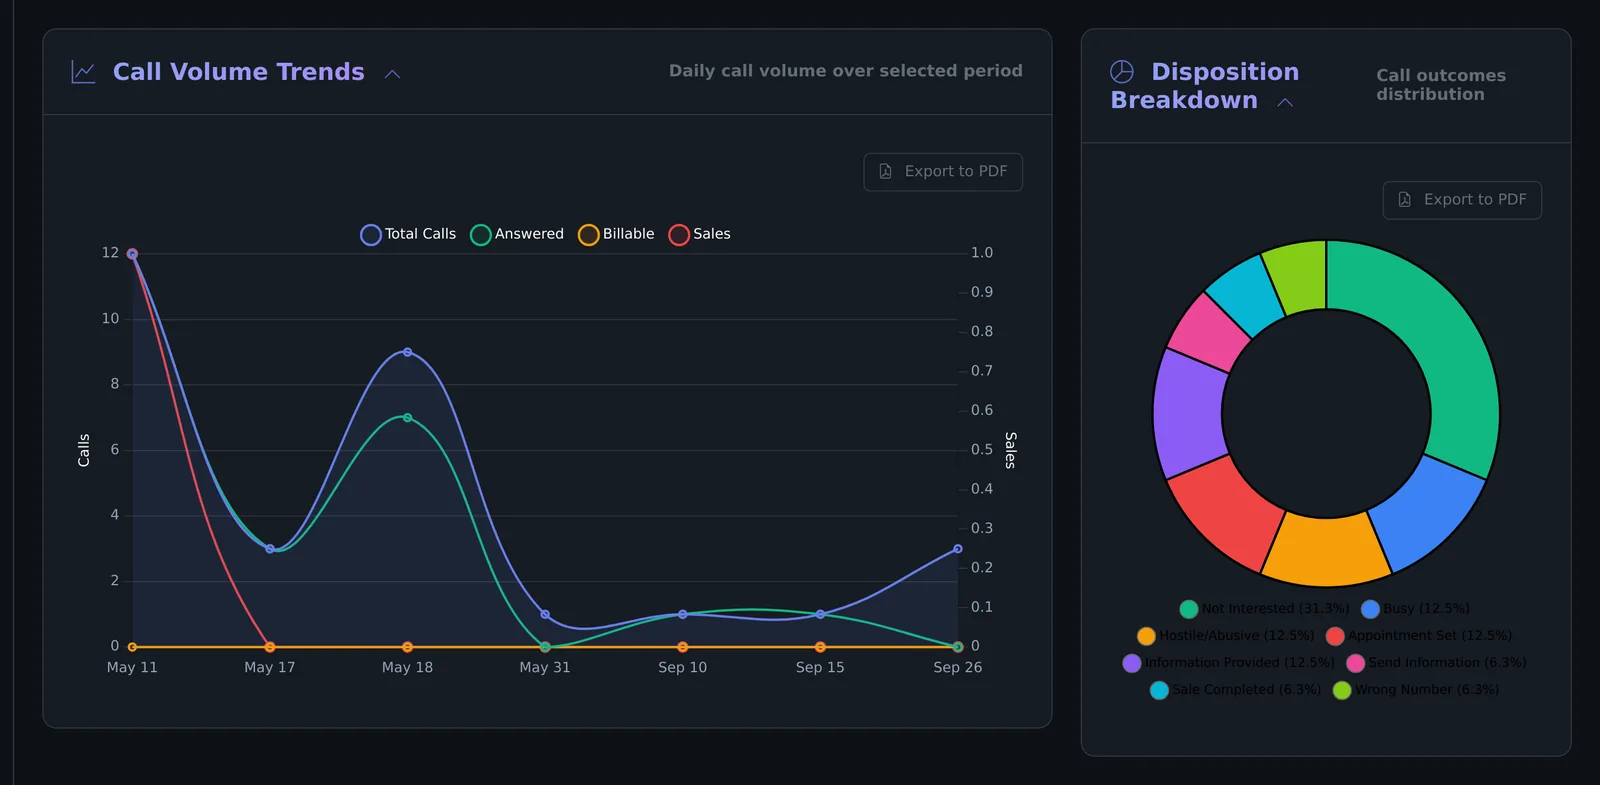
Call Volume Trends and Disposition Breakdown
Call Volume Trends plots Total Calls, Answered, Billable and Sales per day. Disposition Breakdown shows the share of each disposition as a ring chart. Each has Export to PDF.
Queue results
Calls, sales and cost per queue are on this page too.
- Choose the date range.
- Expand Performance By and select the Queue tab, or Global Queue for global queues your agency takes calls from.
- Each row is a queue, with the same columns as the other tabs and a Totals row. Click a heading to sort.
- Select Export to PDF to download the tab. The CSV and Excel exports at the top of the page include a Queue Performance and a Global Queue Performance section.
For compliance per queue, expand Compliance By and select Queue.
Performance by Hour and the Peak Hours Heatmap cover all your calls, not one queue. To see one queue by hour, set up a report in the Custom Report Builder with Queue and Hour of Day (or Day) as dimensions and the queue picked in the Queue filter, then save it.
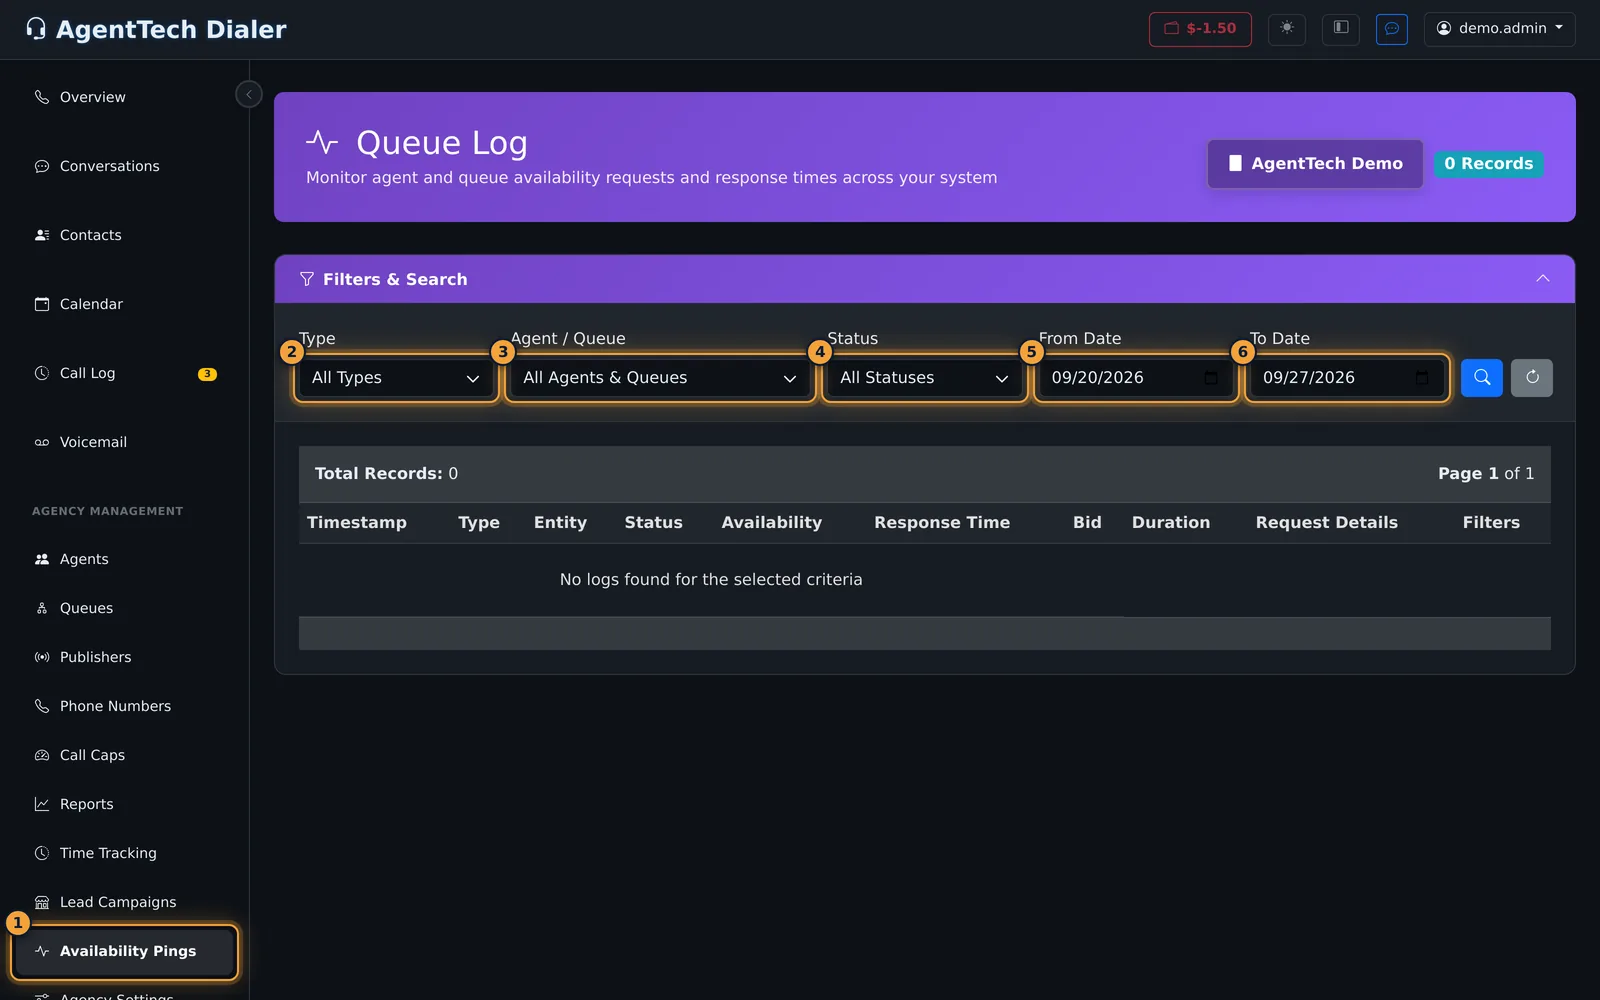
When a publisher or another system checks whether a queue can take a call, the check is logged on Agency Management > Availability Pings. Set Type to Queue Pings to see how many of the queue's agents were available, how quickly your account answered and any bid returned. See Availability Pings.
Export the page
| Button | What you get |
|---|---|
| CSV | One file, call_center_analytics_<date>.csv, with a section per table: agency, publisher, state, agent, global queue, queue and team performance, recent policy sales, and agency and agent compliance. |
| Excel | An .xlsx workbook with a Summary sheet (the KPI cards and their changes) and one sheet per table, including the agent scorecard and compliance tables. |
| The browser's print window for the page. | |
| Export to PDF (in a section) | A landscape PDF of that section's open table or chart, headed with the section title and the date range. |
The Excel file is named with the date range, for example AgentTech_Reports_2026-09-01_to_2026-09-27.xlsx, and each section PDF with its title and the range, for example Performance_by_Hour_2026-09-01_to_2026-09-27.pdf.
Build a custom report
- Expand Custom Report Builder at the bottom of the page.
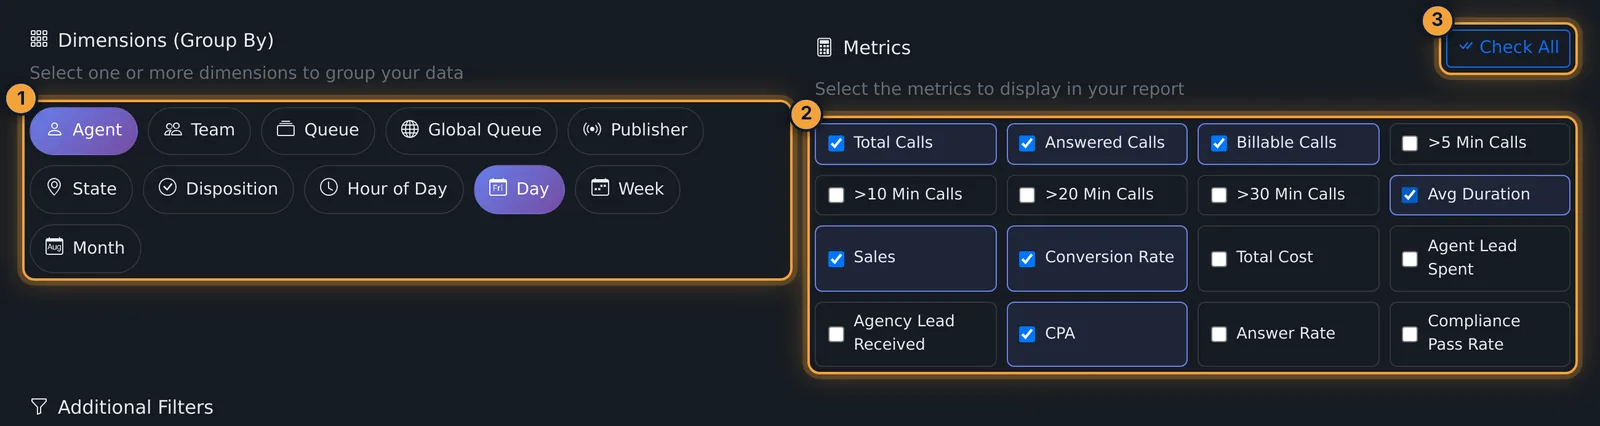
- Under Dimensions (Group By), select one or more dimensions. Rows are grouped by the dimensions you pick.
- Under Metrics, tick the columns you want. Total Calls, Billable Calls, Sales, Conversion Rate and CPA start ticked; Check All ticks or clears every metric.
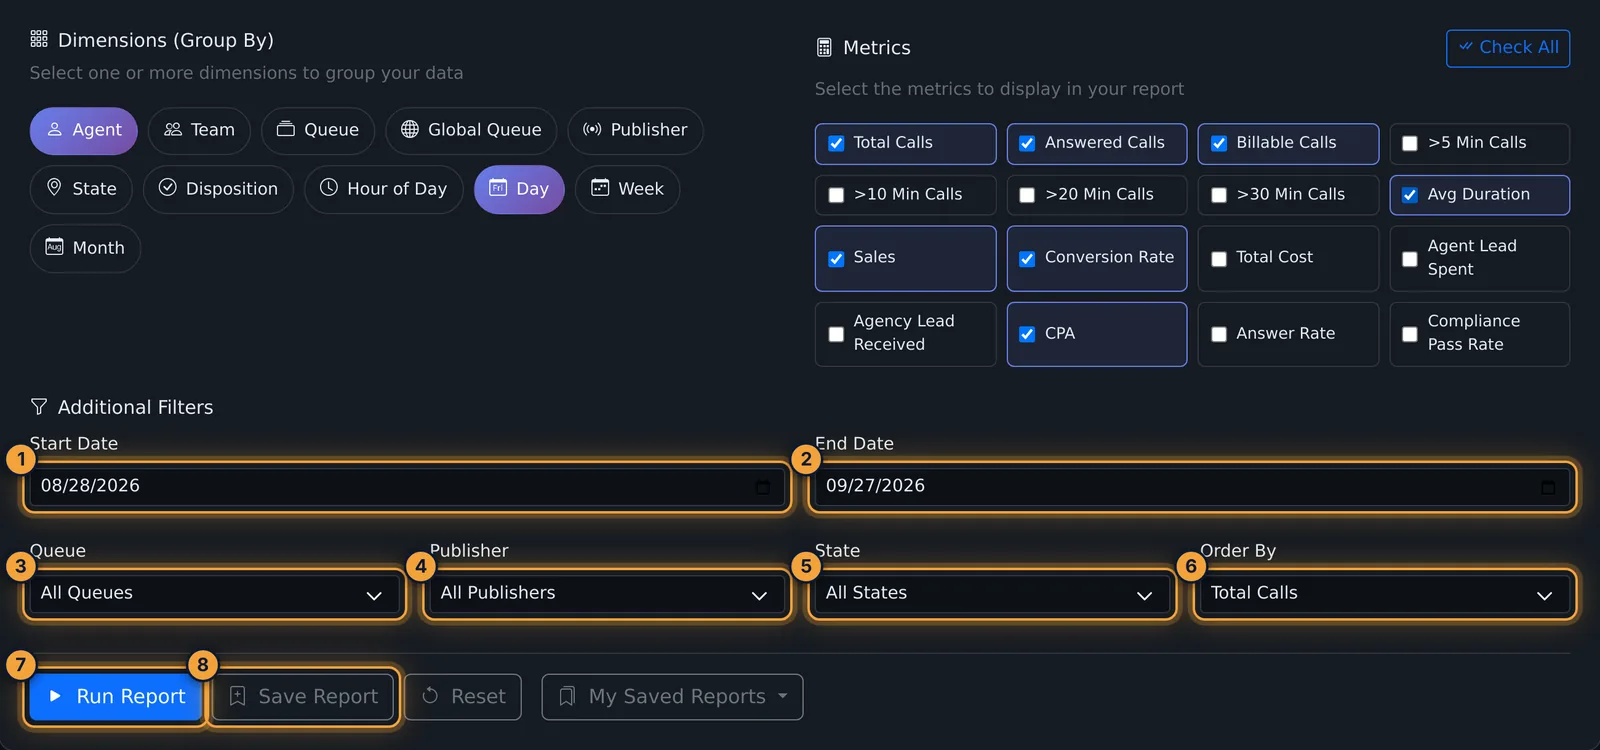
- Under Additional Filters, set Start Date and End Date (the builder has its own range, starting at the last 30 days). Optionally limit to one Queue, Publisher or State.
- Choose Order By: Total Calls, Sales, Conversion Rate, CPA or Total Cost. The report is sorted highest first.
- Select Run Report. A message confirms "Report generated" with the number of rows, and the results appear under Report Results.
| Dimensions | Metrics |
|---|---|
| Agent, Team, Queue, Global Queue, Publisher | Total Calls, Answered Calls, Billable Calls |
| State | >5, >10, >20 and >30 Min Calls, Avg Duration |
| Disposition | Sales, Conversion Rate, Answer Rate |
| Hour of Day, Day, Week, Month | Total Cost, Agent Lead Spent, Agency Lead Received, CPA, Compliance Pass Rate |
Read the results
- Rows and columns. One row per combination of your dimensions, for example one row per agent per day. The dimension columns come first, then one column per metric, in the order you ticked them.
- Order. Rows are sorted by the Order By metric, highest first. To change the order, pick another Order By and run the report again.
- Formats. Money shows as dollars with two decimals, rates as percentages with one decimal, and durations as M:SS or H:MM:SS. CPA shows N/A for a row with no sales.
- Summary line. Under the table, "Generated at" gives the time the report ran and the number of rows.
- Nothing matched. The table reads "No data found for selected criteria". Widen the dates or remove a filter.
To keep the results, select Excel for an .xlsx file with a Custom Report sheet, or PDF for a landscape PDF titled "Custom Report" with the time it was generated. Both contain the table as shown and are named with today's date, for example custom_report_2026-09-27.xlsx.
Reset clears the dimensions, puts the metrics back to the default five and hides the results.
Save a report
- With at least one dimension and one metric selected, select Save Report.
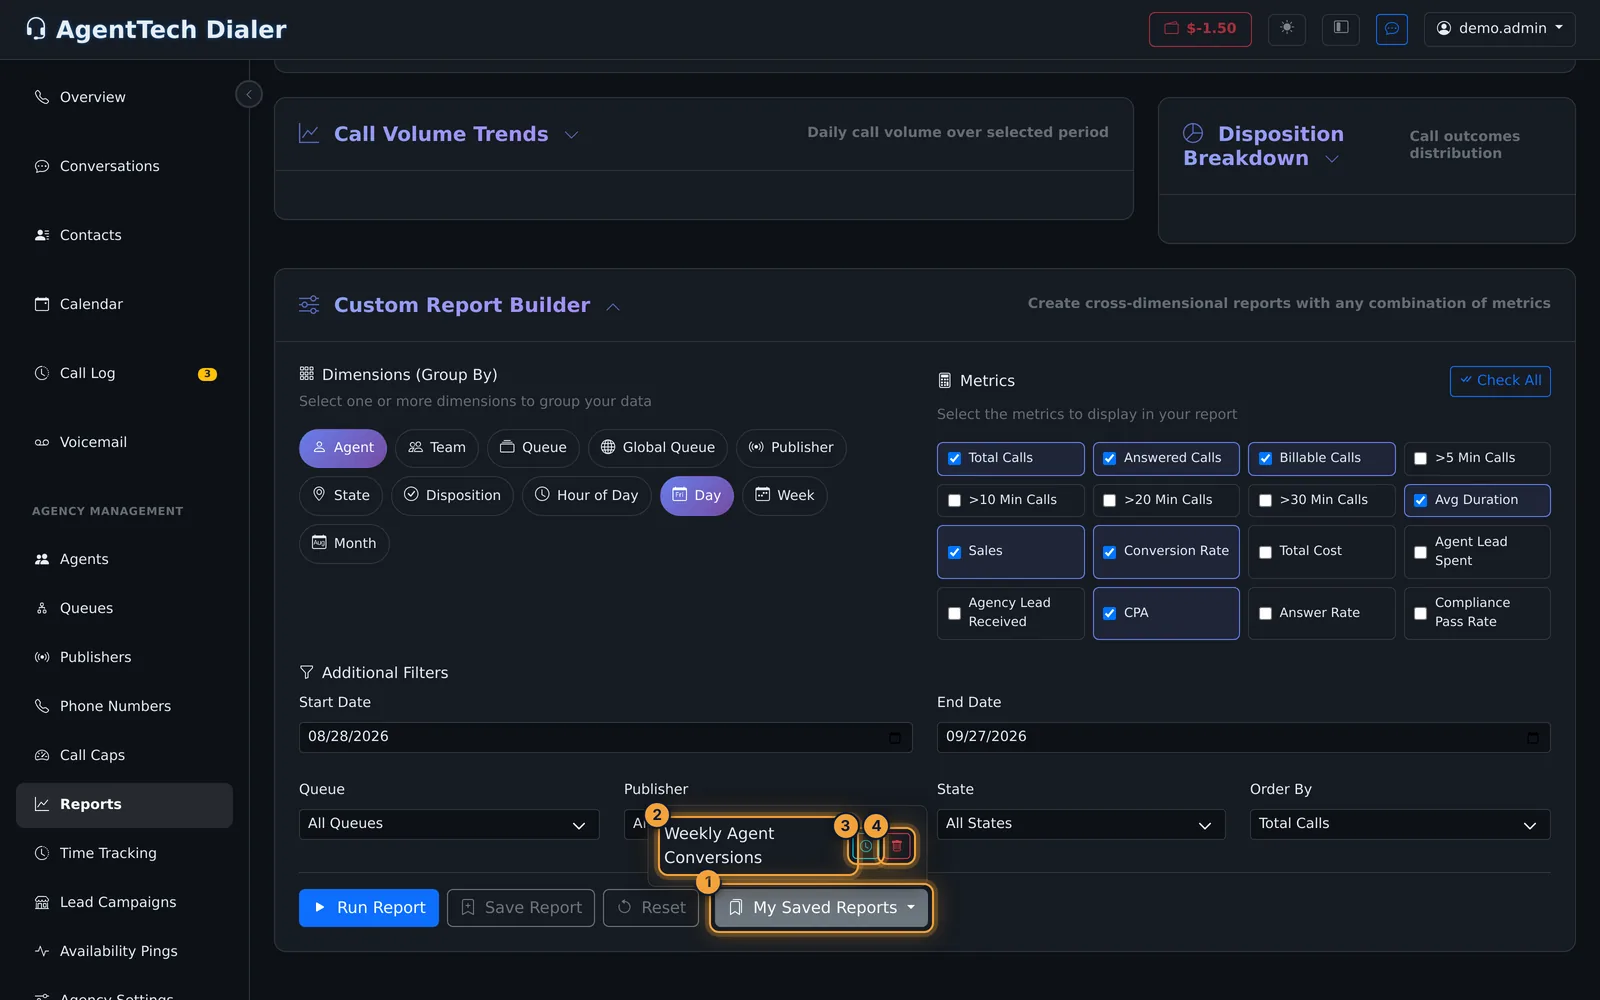
- Type a name, for example Weekly Agent Conversions, and confirm. The dimensions, metrics, filters and order are saved; the dates are not.
- Open My Saved Reports to find it. Click the name to load it for the builder's current dates. On reports you created, the clock button schedules it and the bin deletes it (after a confirmation).
Schedule a report by email
- In My Saved Reports, select the clock button next to your report.
- In Schedule Report, fill in the form. If the report already has a schedule, the form opens with its settings.
- Select Save Schedule. The report is generated and emailed to the recipients at the chosen time.
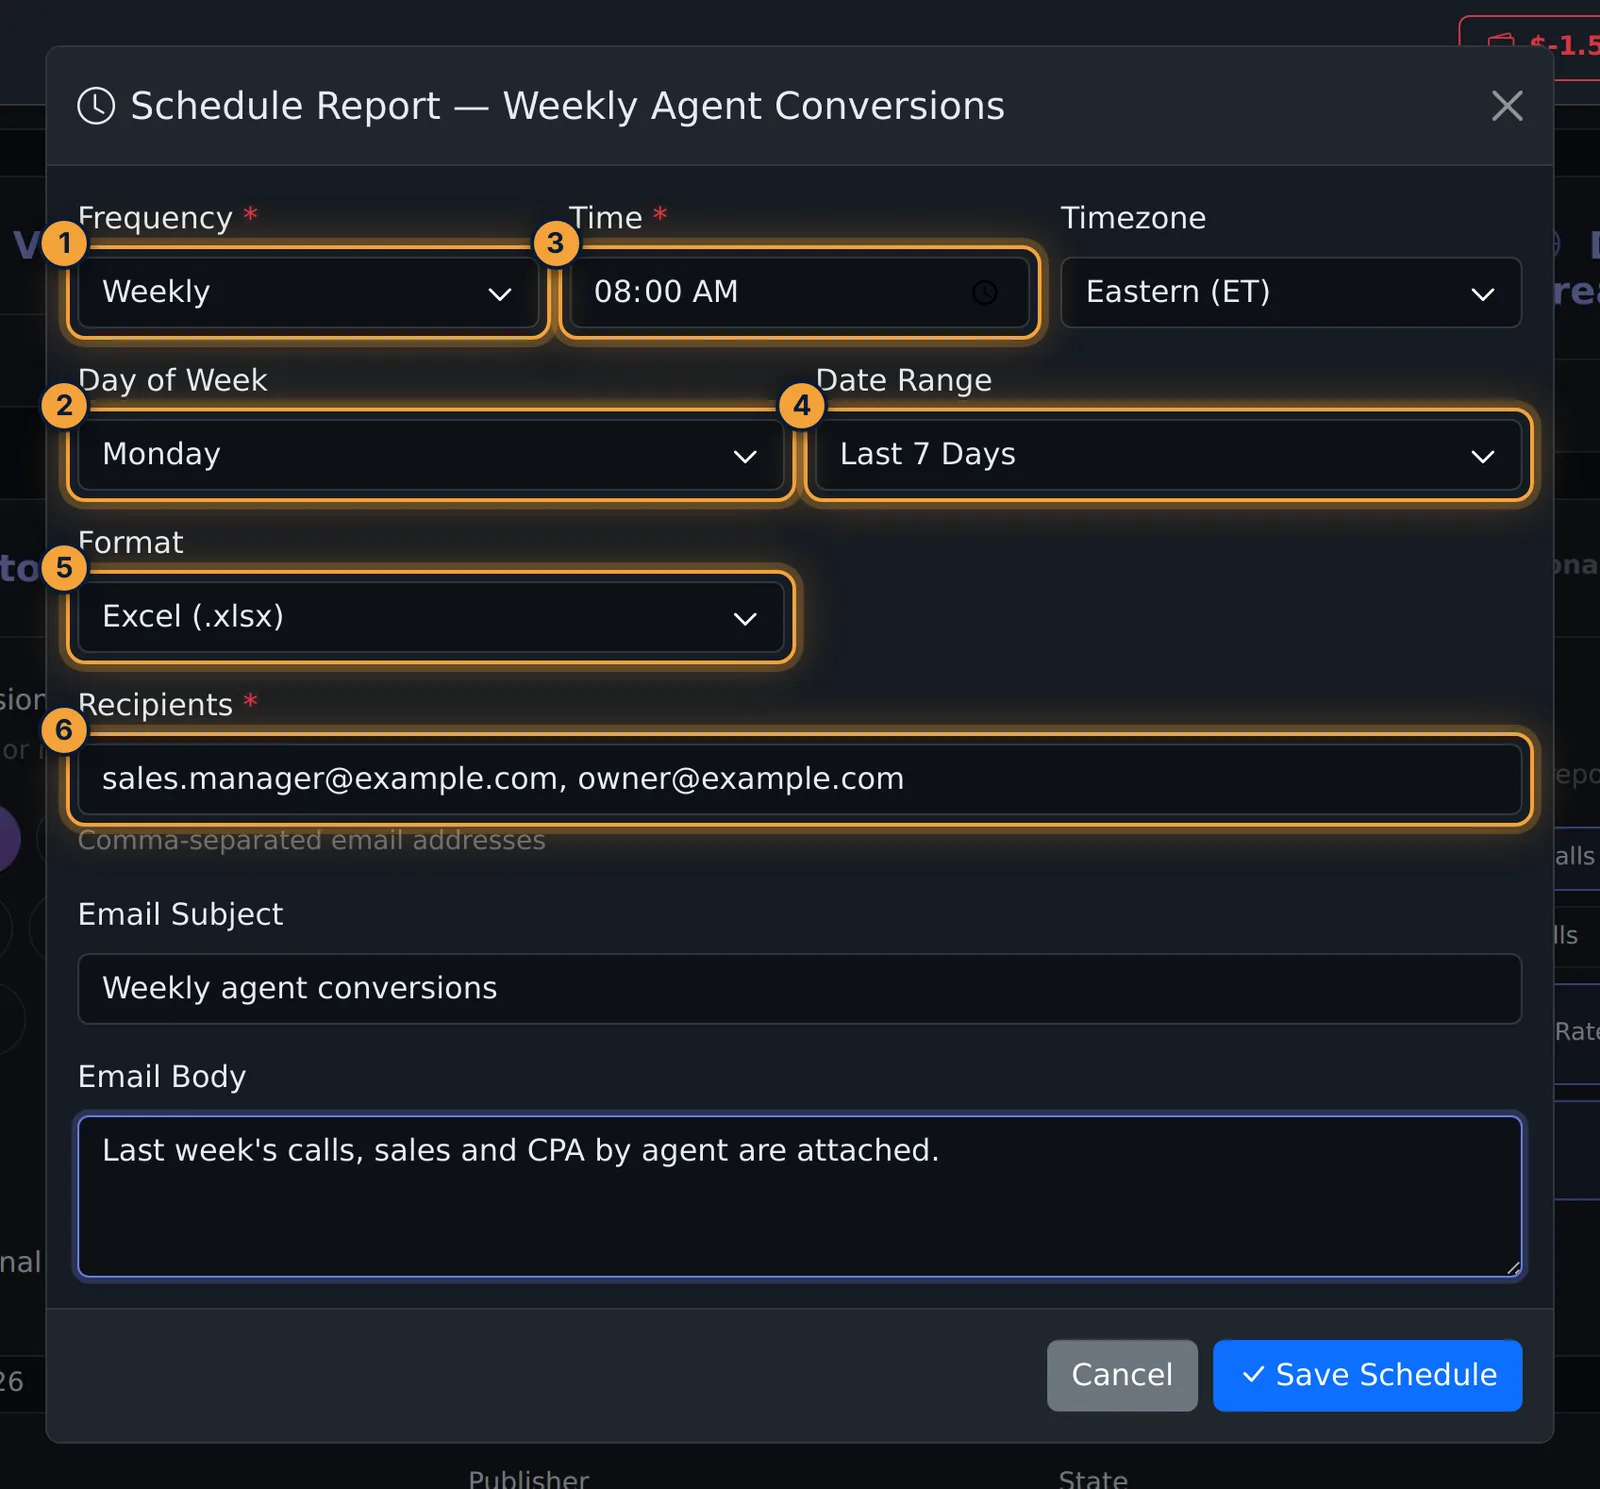
| Field | What it does |
|---|---|
| Frequency | Daily, Weekly or Monthly. Required. |
| Day of Week | Weekly only: Monday to Sunday. |
| Day of Month | Monthly only: 1 to 28. |
| Time | When it runs. Required; starts at 08:00. |
| Timezone | Eastern, Central, Mountain, Pacific or UTC. |
| Date Range | The period each email covers: Yesterday, Last 7 Days, Last 30 Days or Last Month. |
| Format | Excel (.xlsx) or CSV (.csv). |
| Recipients | Email addresses separated by commas. Required; each is checked for a valid format. |
| Email Subject / Email Body | Optional. The subject suggests "Scheduled Report: {report_name}". |
Once the schedule has sent, the form shows Recent Delivery History: when it was sent, how many recipients got it (and how many failed), the status and the number of rows.
Common problems
- A tab says "No data available for the selected filters". Nothing matched in that range; widen the range or turn off Billable Only. Team, Publisher and Global Queue stay empty if your agency doesn't use teams, publishers or global queues.
- The Queue tab is empty. No calls in the range came in through a queue. Try a longer range or turn off Billable Only.
- A number looks wrong, for example Conv % is 0.00% although there were sales. Check the definition in KPIs & Leaderboard.
- "Please select at least one dimension". The builder needs a dimension and a metric before it runs or saves.
- No clock button on a saved report. Only the person who created a report can schedule or delete it.
- Something else is wrong. See Getting Help.
Related articles
Was this article helpful?
Can't find what you are looking for? Our support team can help.
Submit a support ticket