Before a publisher or another outside system sends a call, it can ask whether one of your queues or agents can take it. Each of those requests is an availability ping. The Availability Pings page logs every ping with the answer your account gave and how long it took, so you can see who is checking your capacity and whether your queues looked open when they did.
Who can do this: agency admins. Open Agency Management > Availability Pings in the sidebar. The page itself is titled Queue Log.
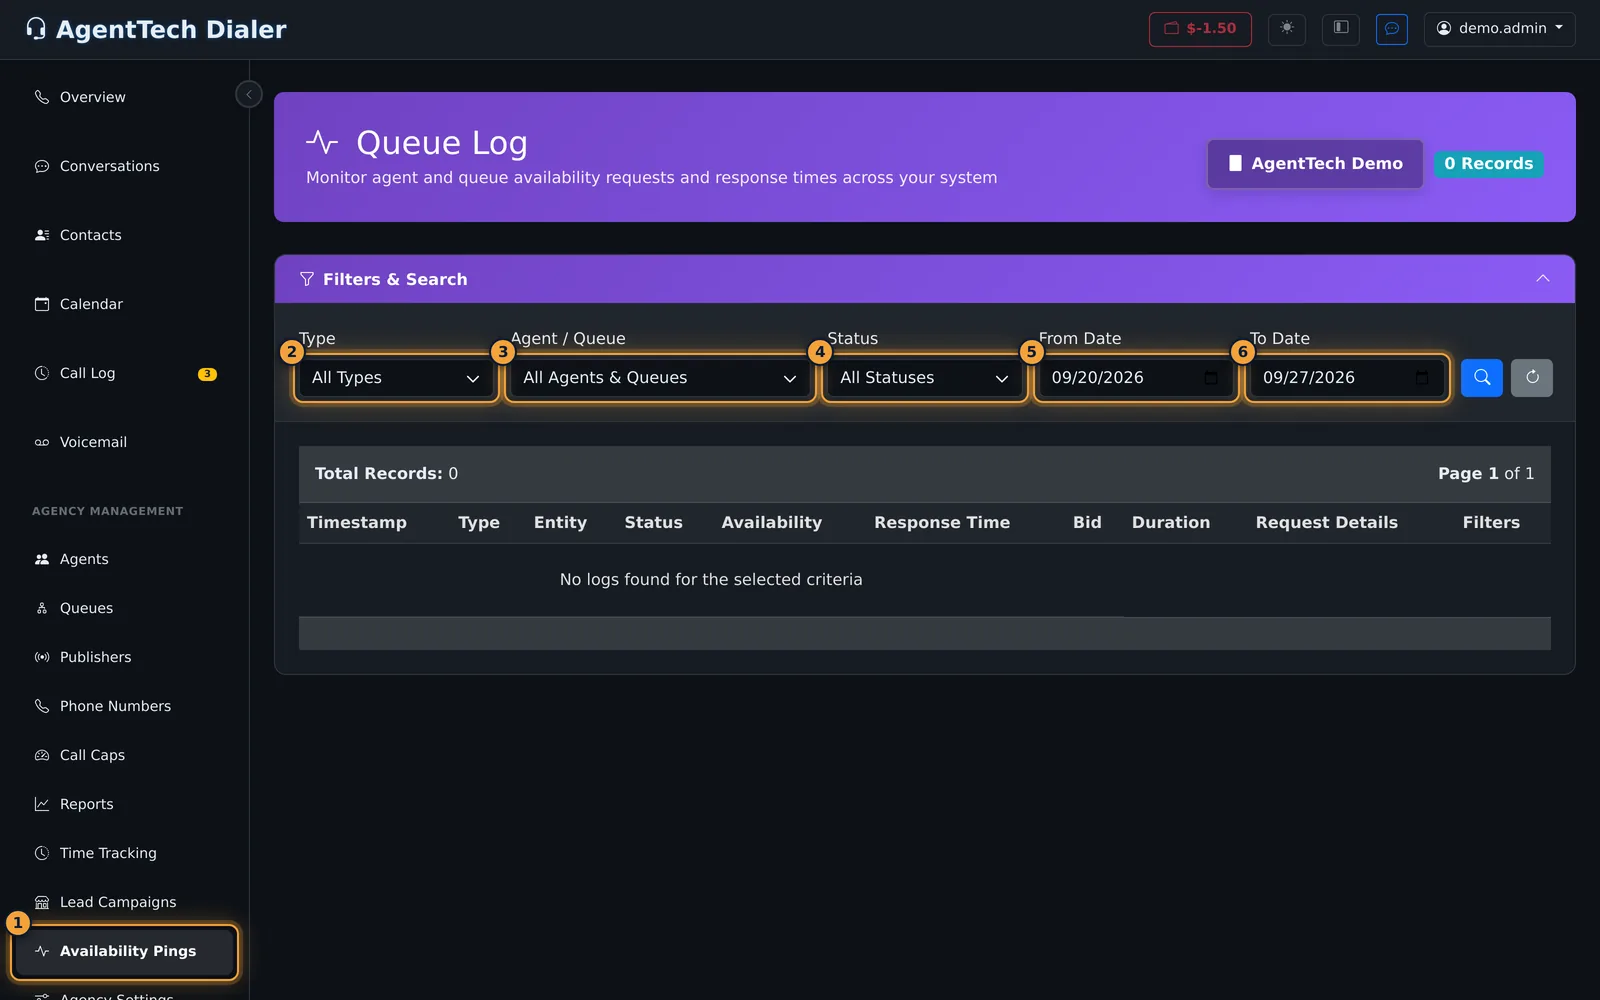
Filter the log
- Open Agency Management > Availability Pings. The log shows the last seven days.
- Choose the filters. The table reloads as soon as a filter changes; the search button does the same.
- To start over, select the reset button next to search.
| Filter | Options |
|---|---|
| Type | All Types, Agent Pings, Queue Pings. |
| Agent / Queue | Every agent and queue that appears in the log. |
| Status | Every status that appears in the log. |
| From Date / To Date | The date range. The default is the last seven days. |
The filters are kept in the page address, so you can bookmark or share a filtered view. The header shows the total number of records, and the table pages through them 50 at a time.
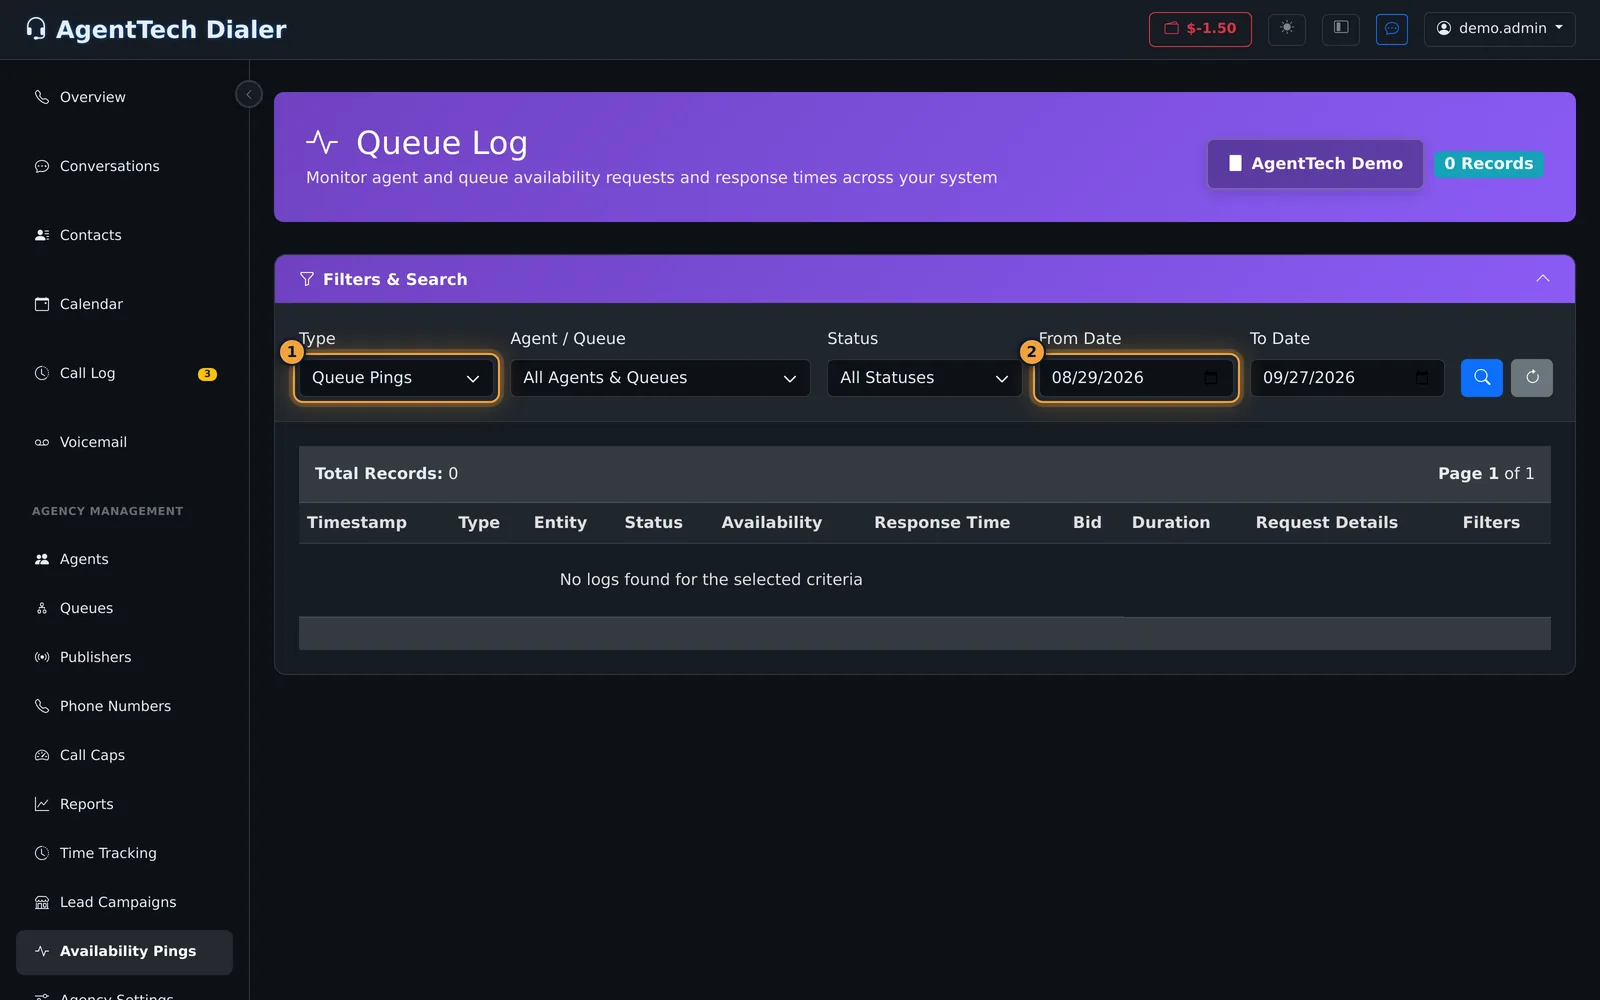
What each column means
| Column | What it shows |
|---|---|
| Timestamp | When the ping arrived, in your browser's time. |
| Type | Agent or Queue. |
| Entity | The agent's or queue's name, with its identifier underneath. |
| Status | For agent pings, the agent's status at that moment (for example Available or On A Call). For queue pings, whether the request succeeded or returned an error. |
| Availability | Agent pings: 1 if the agent was available, 0 if not. Queue pings: available agents out of total agents, with the percentage available. |
| Response Time | How long your account took to answer, in milliseconds. Under 100 ms shows as fast, 500 ms or more as slow. |
| Bid | The bid returned with the answer, when there is one. |
| Duration | The duration in seconds returned with the answer, when there is one. |
| Request Details | The caller's IP address, the first eight characters of the API key if one was used, and View Details (hover) for the full request URL and user agent. |
| Filters | Queue pings only: the skill, state or caller ID the request asked to match. |
When the log is empty
The log only fills when something outside your account checks availability, usually a publisher sending calls to one of your queues. Until then the table shows "No logs found for the selected criteria" and the header reads 0 Records. Once a publisher starts checking, each check appears here with the columns above.
Common problems
- Nothing appears. No outside system has checked your availability in the date range. Widen the dates, or confirm with the publisher that they are sending checks.
- Queue pings show 0 available agents. No agent in that queue was Available at that moment. Compare with Time Tracking and the Supervisor Dashboard.
- Many slow responses. Response times of 500 ms or more are marked slow. Note the times and share them with support.
Related articles
Was this article helpful?
Can't find what you are looking for? Our support team can help.
Submit a support ticket